

DLD-Based Villa Performance Evidence
Dubai Villa Performance Case Studies
Explore how selected villas across established, premium and newer Dubai communities recorded capital appreciation and rental income over time.
The evidence includes exceptional highest-performing properties; separate representative same-property cases; screened cohort averages and medians; acquisition prices; later recorded values; holding periods; historical rental income; and clearly disclosed limitations. The purpose is not to promise that the next buyer will achieve the same result — it is to understand how community, entry price, property selection, time and ownership strategy influenced real recorded outcomes.
Highest recorded. Representative property. Screened average. A clearer view of historical villa performance.
Exceptional • Representative • Average
One Number Does Not Explain the Complete Performance Story
An Actual Property
A real property representing the strongest defensible same-property result found within the reviewed records. It demonstrates the upper end of the historical evidence identified — not the expected return for another property or future buyer.
Actual property · upper end of the reviewed evidenceA Separate Actual Property
A different actual property selected because its result was close to the median of the valid screened cohort — a more central property-level example than the maximum result.
Representative same-property case near the screened-cohort medianA Cohort Statistic
The arithmetic mean of all valid properties in the defined research cohort. It gives broader context but can be influenced by exceptionally high or low cases. It is not a third property.
Average of the valid screened cohortCurrent-Buyer Position
None of the three historical figures automatically predicts what a buyer entering today will receive. A new buyer requires a fresh calculation using:
- current acquisition price
- achievable rent
- transaction expenses
- maintenance
- finance
- vacancy
- intended holding period
- future supply
- exit assumptions
Historical evidence explains what happened. Current-buyer analysis determines whether a property makes sense now.
Follow the Property
The Research Uses Same-Property Histories
For capital, the research follows one property from its first recorded developer sale to its latest valid resale. For rental, it matches the same property’s recorded acquisition price with its recorded annual rent.
Capital-appreciation evidence
Historical rental-yield evidence
The same property’s recorded acquisition price.
The property’s recorded annual rent at property level.
The property subtype is preserved (standalone villa).
Implausible or incomplete records are excluded.
Annual rent divided by the recorded acquisition price — historical yield on cost, not current-market yield or net ROI.
Evidence status
A clean same-property chain or a plausible same-property rental record.
A case where a more cautious acquisition basis provides a more defensible public result.
A record containing an unresolved property, subtype, price or rental anomaly.
Methodology, data-quality controls and redaction policy
- Gross appreciation = latest recorded resale value minus the first recorded developer-sale value. Gross appreciation percentage = gross appreciation divided by the first recorded developer-sale value.
- Property-type control: the primary rental comparison uses standalone villas; townhouses, cluster properties and compact townhouse-style products are separated where relevant.
- Data-quality controls: records may be excluded or treated conservatively for partial sales, changed plot size, implausibly low developer registrations, duplicate same-month records, below-developer intermediate entries, implausible annual rents, incomplete rental information or property-subtype mismatch.
- The highest case is the strongest defensible chain; the representative property is the real property nearest the valid cohort median.
- Evidence references: capital cases retain stable property-timeline references; rental cases are supported by named per-unit rental-view records. Property identifiers remain redacted in public-facing content.
Cross-Community Evidence
Highest, Representative and Average Historical Outcomes
The screened average is shown as a statistic, never as a third actual property. Communities are presented without ranking.
Capital-appreciation overview
| Community | Highest actual property | Representative actual property | Screened average | Screened median | Cohort |
|---|---|---|---|---|---|
| Palm Jumeirah | +1,957% | +659% | +962.6% public clean mean | +659% | 5 clean |
| Arabian Ranches 1 | +1,173% | +308% | +451.1% | +274.0% | 10 |
| Victory Heights | +712.1% | +271.1% | +419.8% | +432.5% | 4 |
| Emirates Living | +518% conservative basis | +337% | +367.3% conservative mean | +337% | 3 |
| Dubai Hills Estate | +481.6% | +208.1% | +240.0% | +192.5% | 4 |
| Jumeirah Park | +354.7% | +177.3% | +266% | +266% | 2 clean |
| Arabian Ranches 2 | +101.7% | +84.0% | +73.6% | +84.0% | 5 |
Rental-yield overview
| Community | Highest actual villa | Representative actual villa | Screened average | Screened median | Villa cohort |
|---|---|---|---|---|---|
| Palm Jumeirah | 32.22% | 24.04% | 20.36% | 24.04% | 7 |
| Emirates Living | 23.17% | 15.71% | 14.48% | 14.80% | 12 |
| Arabian Ranches 1 | 26.67% | 9.20% | 10.02% | 8.40% | 10 |
| Dubai Hills Estate | 13.29% | 9.56% | 10.24% | 11.17% | 4 |
| Arabian Ranches 2 | 12.69% | 9.17% | approximately 10.6% | approximately 9.5% | 14 |
| Jumeirah Park | 12.36% | 8.29% | approximately 8.8% | approximately 8.3% | 15 |
| Victory Heights | 11.56% | 9.82% | approximately 11% | approximately 9.8% | 13 |
All rental percentages are historical gross yields on recorded acquisition cost. They are not current-market yields and do not include vacancy, finance, maintenance, management or other ownership expenses.
Public-data treatment
The Palm public mean and median use five clean records after removing a changed-plot case from the public average. The Emirates Living public mean uses the conservative +518% basis for the ambiguous highest property rather than the flagged +2,442% calculation. These treatments follow the supplied instruction not to publish flagged results as headlines; the underlying consolidated research otherwise reports the original screened means and flags.
Legacy Family Community • Emaar
Arabian Ranches 1: Long Holding, Strong Historical Differentiation
The reviewed records show how early acquisition prices, mature community positioning and long holding periods produced materially different outcomes across separate villas.

Arabian Ranches 1
Saheel standalone villa
- Bedrooms
- 3
- Plot
- 15,801 sq ft
- First developer sale
- May 2008
- Acquisition
- AED 1,358,888
- Latest resale
- Aug 2025
- Latest value
- AED 17,300,000
- Holding
- ~17.3 yrs
- Annualised
- ~15.9% / yr
Exceptional recorded property history.
Savannah standalone villa
- Bedrooms
- 3
- Plot
- 9,645 sq ft
- First developer sale
- Jan 2008
- Acquisition
- AED 3,900,000
- Latest resale
- Mar 2025
- Latest value
- AED 15,900,000
- Holding
- ~17.2 yrs
- Annualised
- ~8.5% / yr
Representative property near the screened median.
Cohort statistic (not a property)
- Valid properties
- 10
- Screened average
- +451.1%
- Screened median
- +274.0%
- Representative
- +308%
Representative selected from a tie around the median because its transaction chain was cleaner.
Saheel standalone villa
- Bedrooms
- 5
- Acquisition
- AED 1,600,000
- Annual rent
- AED 420,000
Historical gross yield on recorded cost.
Alma 1 standalone villa
- Bedrooms
- 3
- Acquisition
- AED 3,000,000
- Annual rent
- AED 275,000
Near the screened median.
Cohort statistic
- Valid standalone villas
- 10
- Screened average
- 10.02%
- Screened median
- 8.40%
- Wider community context
- ~6%
Two implausible rental rows and townhouse or cluster products excluded.
Evidence, source and disclosures
Source. DXBinteract — Dubai Property Transaction Analytics Based on DLD Data
Data review date. 5 August 2026 · Published
Capital evidence
Same-property capital timeline retained from first recorded developer sale to latest valid resale.
Rental evidence
Historical gross yield from named per-unit rental-view records, using the recorded acquisition price.
Exclusions
Two implausible rental rows and townhouse/cluster products separated from the standalone-villa comparison.
Disclosures
Capital appreciation is measured from the first recorded developer sale to the latest valid resale of the same property; later buyers achieved different returns. Historical gross yield uses the investor’s recorded acquisition price and is not net ROI or a current-market yield. The screened average is a cohort statistic, not a separate property or a community-wide expected return. Property identifiers remain redacted.
The strongest case shows what early entry and long holding made possible. The representative property and rental average show that the broader reviewed evidence remained positive without suggesting every villa reached the maximum result.
Waterfront Scarcity • Nakheel
Palm Jumeirah: Exceptional Long-Term Villa Value
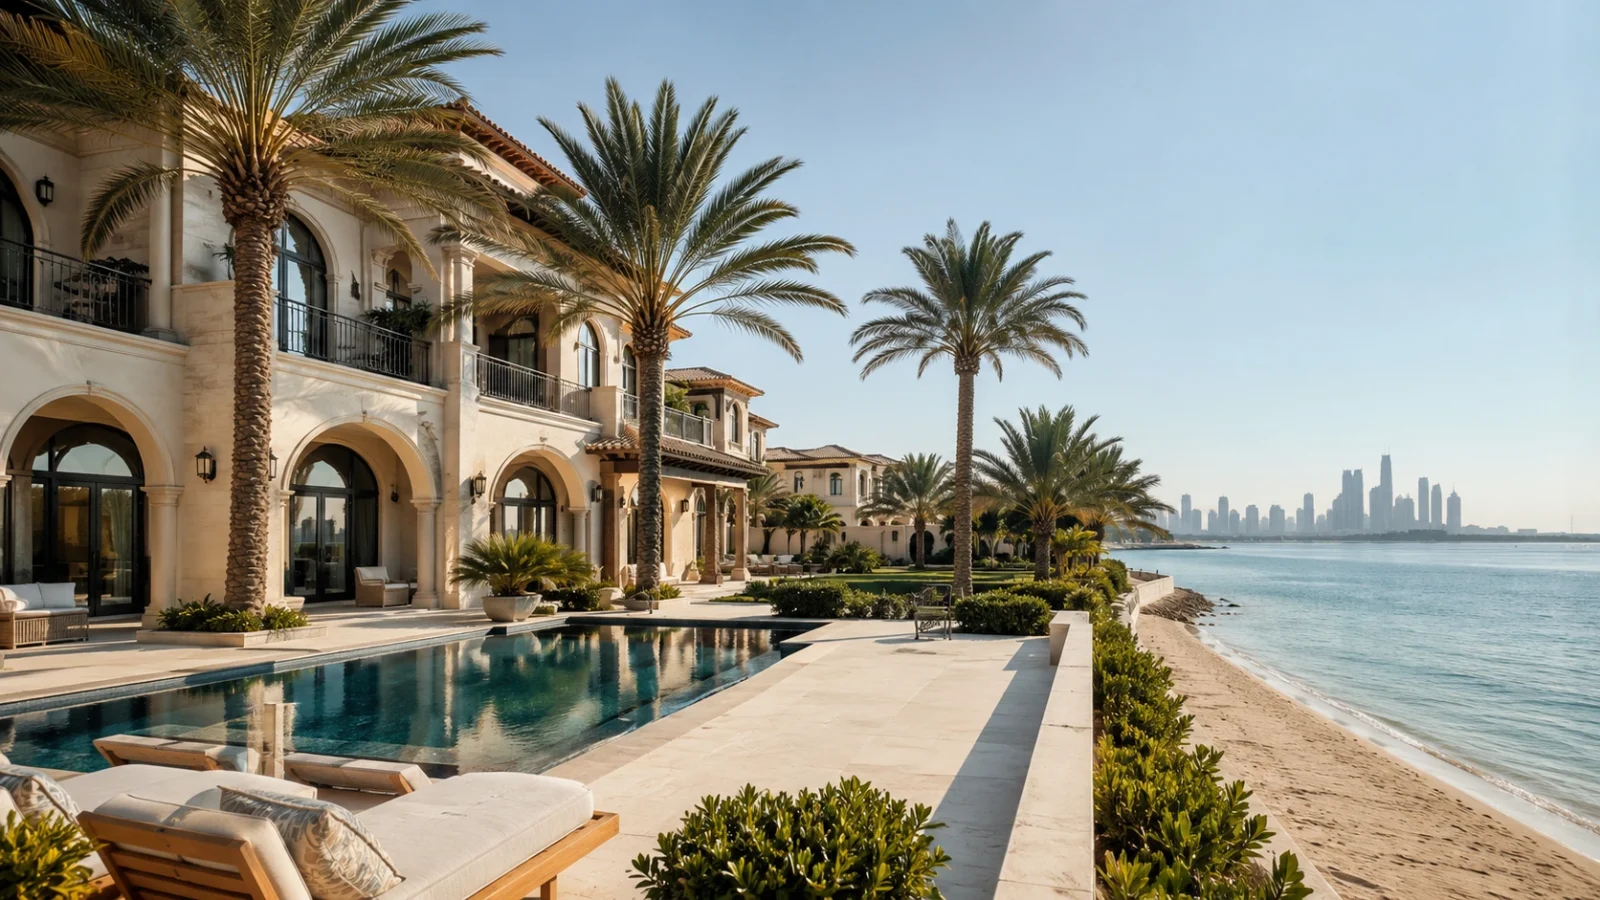
Palm Jumeirah produced the highest clean capital-appreciation case within the reviewed communities. The public context excludes one changed-plot case from the clean cohort average because its property basis may have materially changed.
Palm Jumeirah
Signature Villa — Frond L
- Bedrooms
- 4
- Plot
- 6,699 sq ft
- First developer sale
- Mar 2008
- Acquisition
- AED 2,600,000
- Latest resale
- Jul 2026
- Latest value
- AED 53,500,000
- Holding
- ~18.3 yrs
- Annualised
- ~17.9% / yr
Highest clean capital-appreciation case within the reviewed communities.
Signature Villa — Frond F
- Bedrooms
- 6
- Plot
- 13,400 sq ft
- First developer sale
- Mar 2010
- Acquisition
- AED 14,500,000
- Latest resale
- Nov 2025
- Latest value
- AED 110,000,000
- Holding
- ~15.7 yrs
- Annualised
- ~13.8% / yr
Representative near the screened median.
Public clean mean (not a property)
- Clean public properties
- 5
- Public clean average
- +962.6%
- Public clean median
- +659%
- Representative
- +659%
One higher calculated case was removed from the public average because the recorded plot size increased, indicating a possible rebuild, extension or material property change.
Signature Villa — Frond N
- Bedrooms
- 5
- Acquisition
- AED 9,000,000
- Annual rent
- AED 2,900,000
Historical gross yield on recorded cost.
Signature Villa — Frond M
- Bedrooms
- 4
- Acquisition
- AED 2,600,000
- Annual rent
- AED 625,000
Exactly the cohort median.
Cohort statistic
- Valid Frond villas
- 7
- Screened average
- 20.36%
- Screened median
- 24.04%
An 89.46% calculated rental row was excluded as implausible. Canal Cove townhouses and Palma Residence separated from the standalone Frond-villa cohort.
Evidence, source and disclosures
Source. DXBinteract — Dubai Property Transaction Analytics Based on DLD Data
Data review date. 5 August 2026 · Clean Public Cohort
Capital evidence
Same-property capital timeline retained from first recorded developer sale to latest valid resale.
Rental evidence
Historical gross yield from named per-unit rental-view records, using the recorded acquisition price.
Exclusions
Changed-plot capital case removed from the public average; 89.46% rental row excluded as implausible; townhouse products separated.
Disclosures
Capital appreciation is measured from the first recorded developer sale to the latest valid resale of the same property; later buyers achieved different returns. Historical gross yield uses the investor’s recorded acquisition price and is not net ROI or a current-market yield. The screened average is a cohort statistic, not a separate property or a community-wide expected return. Property identifiers remain redacted.
Palm Jumeirah shows the upper end of long-term historical performance, but the results depend heavily on original-era acquisition prices, waterfront scarcity and long holding periods.
Mansions and Established Villas • Emaar
Emirates Living: Premium Capital and Established Rental Demand
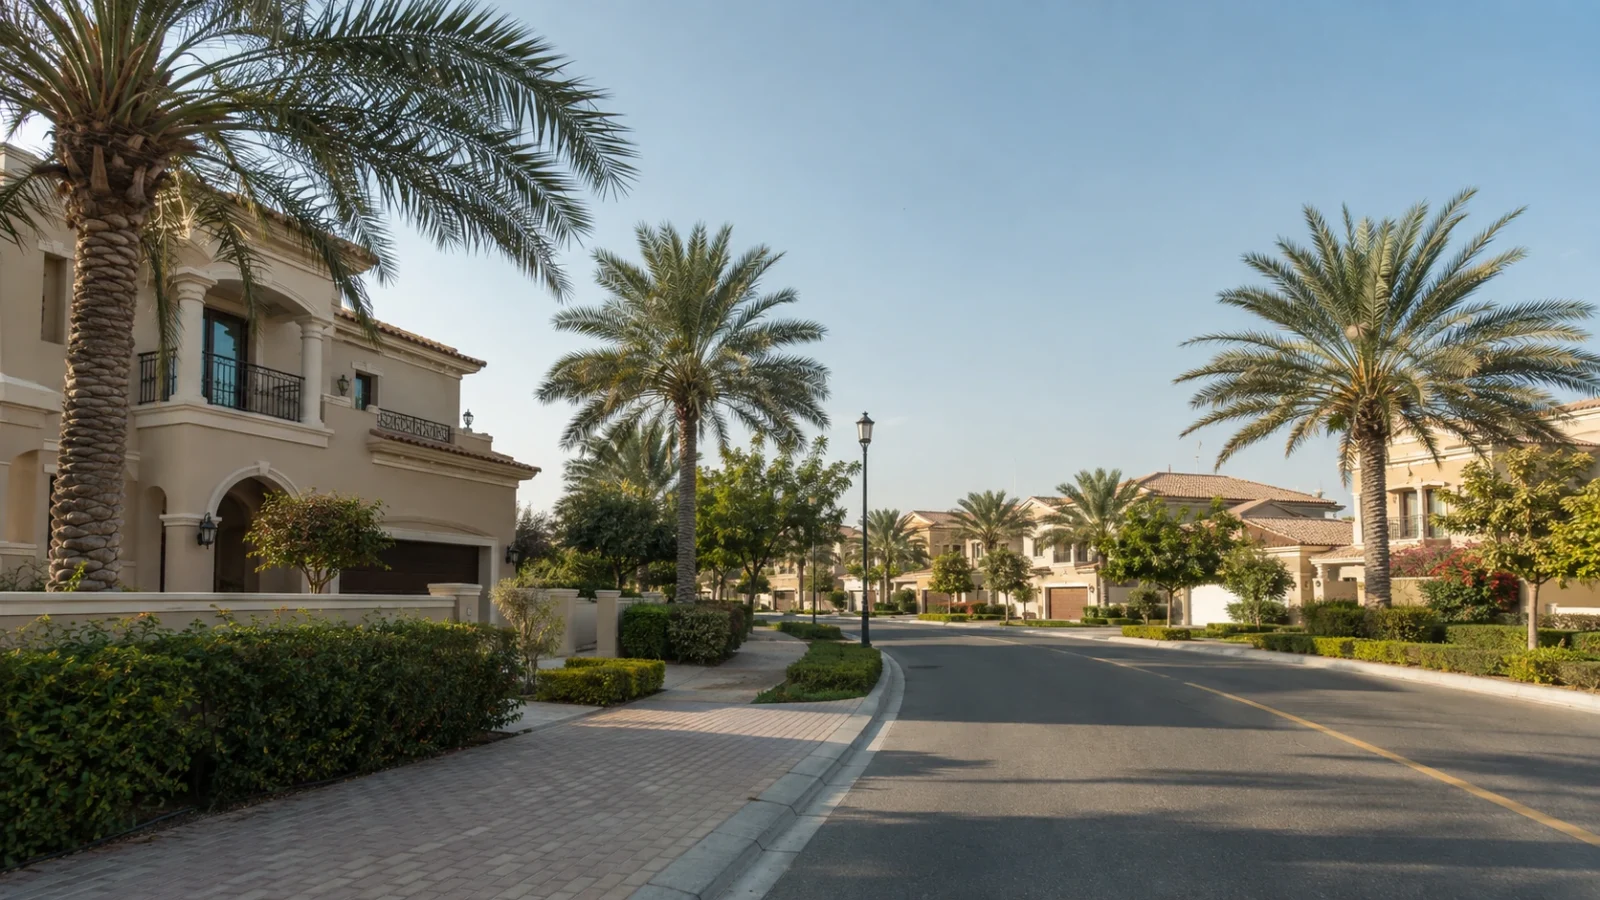
Capital evidence comes from Emirates Hills mansions, while the standalone-villa rental evidence comes from The Meadows. These property formats must remain clearly separated.
Emirates Living
Emirates Hills mansion
- Bedrooms
- 6
- Plot
- 41,211 sq ft
- Conservative public basis
- AED 20,000,000
- Latest resale
- Dec 2025
- Latest value
- AED 123,633,000
- Holding
- ~17.75 yrs
- Annualised
- ~11.0% / yr
The record also contains a lower same-month developer entry that would produce +2,442%. That more aggressive figure is not used as the public headline.
Emirates Hills mansion
- Bedrooms
- 11
- Plot
- 40,804 sq ft
- First developer sale
- Jun 2010
- Acquisition
- AED 13,261,300
- Latest resale
- Sep 2023
- Latest value
- AED 58,000,000
- Holding
- ~13.25 yrs
- Annualised
- ~11.8% / yr
Representative near the screened median.
Conservative public mean
- Clean mansion chains
- 3
- Public conservative average
- +367.3%
- Screened median
- +337%
- Representative
- +337%
The public mean uses +518%, +337% and +247%, rather than the ambiguous +2,442% entry.
The Meadows standalone villa
- Bedrooms
- 5
- Acquisition
- AED 1,600,000
- Annual rent
- AED 370,000
Rental scope: Meadows standalone villas.
The Meadows 2 standalone villa
- Bedrooms
- 5
- Acquisition
- AED 2,700,000
- Annual rent
- AED 420,000
Near the screened median.
Cohort statistic
- Valid Meadows villas
- 12
- Screened average
- 14.48%
- Screened median
- 14.80%
The Springs townhouse results are reported separately and are not merged with the standalone-villa figures.
Evidence, source and disclosures
Source. DXBinteract — Dubai Property Transaction Analytics Based on DLD Data
Data review date. 5 August 2026 · Published Conservatively
Capital evidence
Capital scope: Emirates Hills mansions. Same-property capital timeline retained from first recorded developer sale to latest valid resale.
Rental evidence
Rental scope: Meadows standalone villas. Historical gross yield from named per-unit rental-view records, using the recorded acquisition price.
Conservative treatment
The public headline uses the conservative +518% basis, not the flagged +2,442% calculation; the public mean recomputed to +367.3%. Emirates Hills mansion appreciation and Meadows villa rental performance are kept separate.
Disclosures
Capital appreciation is measured from the first recorded developer sale to the latest valid resale of the same property; later buyers achieved different returns. Historical gross yield uses the investor’s recorded acquisition price and is not net ROI or a current-market yield. The screened average is a cohort statistic, not a separate property or a community-wide expected return. Property identifiers remain redacted.
Emirates Living demonstrates why property subtype matters. Emirates Hills mansion appreciation and Meadows villa rental performance should not be blended into one generic community return.
Newer Family Community • Emaar
Arabian Ranches 2: More Moderate but Positive Screened Outcomes
Arabian Ranches 2 is newer than Arabian Ranches 1, Palm Jumeirah and Victory Heights. Its recorded percentages are more moderate, illustrating how community vintage and acquisition period influence the available growth history.

Arabian Ranches 2
Casa standalone villa
- Bedrooms
- 4
- Plot
- 4,359 sq ft
- First developer sale
- Nov 2014
- Acquisition
- AED 3,568,888
- Latest resale
- Apr 2025
- Latest value
- AED 7,200,000
- Holding
- ~10.4 yrs
- Annualised
- ~7.0% / yr
More moderate percentages reflect a newer community vintage and later acquisition period.
Casa standalone villa
- Bedrooms
- 4
- Plot
- 5,784 sq ft
- First developer sale
- Apr 2014
- Acquisition
- AED 4,110,888
- Latest resale
- Mar 2026
- Latest value
- AED 7,565,000
- Holding
- ~11.9 yrs
- Annualised
- ~5.3% / yr
Exactly the median.
Cohort statistic
- Valid properties
- 5
- Screened average
- +73.6%
- Screened median
- +84.0%
- Representative
- +84.0%
One property recorded only ~+9.8% from developer sale to latest resale after previously reaching a higher value — not every villa followed the same path.
Camelia 2 standalone villa
- Bedrooms
- 3
- Acquisition
- AED 1,300,000
- Annual rent
- AED 170,000
Historical gross yield on recorded cost.
Camelia standalone villa
- Bedrooms
- 3
- Acquisition
- AED 1,800,000
- Annual rent
- AED 165,000
Near the screened median.
Cohort statistic
- Valid villas
- 14
- Screened average
- ~10.6%
- Screened median
- ~9.5%
Standalone-villa cohort.
Evidence, source and disclosures
Source. DXBinteract — Dubai Property Transaction Analytics Based on DLD Data
Data review date. 5 August 2026 · Performance Varied
Capital evidence
Same-property capital timeline retained from first recorded developer sale to latest valid resale.
Rental evidence
Historical gross yield from named per-unit rental-view records, using the recorded acquisition price.
Cohort note
One property recorded only approximately +9.8%, demonstrating that not every villa followed the same path.
Disclosures
Capital appreciation is measured from the first recorded developer sale to the latest valid resale of the same property; later buyers achieved different returns. Historical gross yield uses the investor’s recorded acquisition price and is not net ROI or a current-market yield. The screened average is a cohort statistic, not a separate property or a community-wide expected return. Property identifiers remain redacted.
The highest result was positive, the representative property also recorded meaningful appreciation, and the cohort included a materially weaker case. This is the balanced evidence the page should communicate.
Large Plots • Nakheel
Jumeirah Park: Plot Relevance and Property-Specific Performance
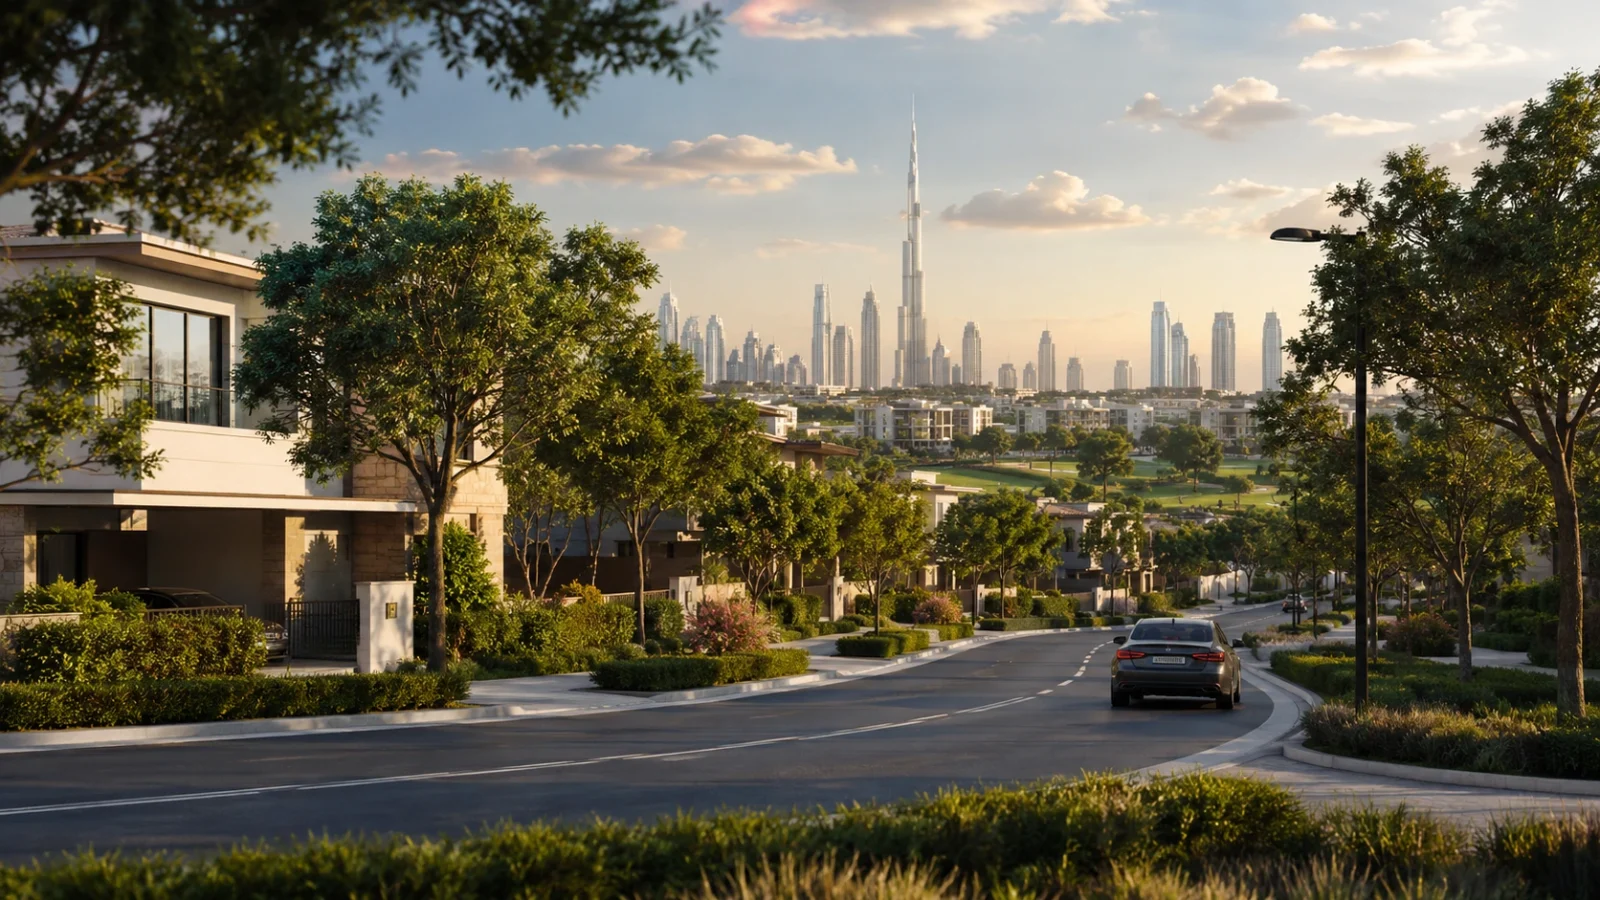
Jumeirah Park demonstrates why suspiciously low historic registrations must be tested before a performance percentage is published. Two apparently higher capital cases were excluded.
Jumeirah Park
District 3 standalone villa
- Bedrooms
- 4
- Plot
- 7,965 sq ft
- First developer sale
- Feb 2013
- Acquisition
- AED 3,365,100
- Latest resale
- Jun 2025
- Latest value
- AED 15,300,000
- Holding
- ~12.3 yrs
- Annualised
- ~13.1% / yr
Two apparently higher capital cases were excluded because the early registrations appeared implausibly low.
District 2 standalone villa
- Bedrooms
- 5
- Plot
- 10,194 sq ft
- First developer sale
- Jun 2013
- Acquisition
- AED 4,977,000
- Latest resale
- Feb 2026
- Latest value
- AED 13,800,000
- Holding
- ~12.7 yrs
- Annualised
- ~8.4% / yr
Lower property in an equally spaced two-case cohort.
Indicative — not community-wide
- Clean properties
- 2
- Screened average
- +266%
- Screened median
- +266%
The clean cohort is small and must be labelled indicative rather than community-wide.
District 9 standalone villa
- Bedrooms
- 4
- Acquisition
- AED 2,800,000
- Annual rent
- AED 340,000
Historical gross yield on recorded cost.
District 9 standalone villa
- Bedrooms
- 4
- Acquisition
- AED 4,200,000
- Annual rent
- AED 350,000
Near the screened median.
Cohort statistic
- Valid villas
- 15
- Screened average
- ~8.8%
- Screened median
- ~8.3%
Standalone-villa cohort.
Evidence, source and disclosures
Source. DXBinteract — Dubai Property Transaction Analytics Based on DLD Data
Data review date. 5 August 2026 · Small Clean Cohort: n=2
Capital evidence
Same-property capital timeline retained from first recorded developer sale to latest valid resale.
Rental evidence
Historical gross yield from named per-unit rental-view records, using the recorded acquisition price.
Exclusions
Two apparently higher capital cases excluded (implausibly low early registrations). The clean capital cohort of two is indicative, not community-wide.
Disclosures
Capital appreciation is measured from the first recorded developer sale to the latest valid resale of the same property; later buyers achieved different returns. Historical gross yield uses the investor’s recorded acquisition price and is not net ROI or a current-market yield. The screened average is a cohort statistic, not a separate property or a community-wide expected return. Property identifiers remain redacted.
Jumeirah Park shows strong selected capital histories, but the capital cohort is too small to describe the screened mean as the average result for all community villas.
Golf Community • Long-Term Holding
Victory Heights: Strong Legacy-Community Performance
Victory Heights produced a clean long-term highest case and a broader screened cohort with materially different outcomes.

Victory Heights
Carmen standalone villa
- Bedrooms
- 5
- Plot
- 10,237 sq ft
- First developer sale
- Jul 2009
- Acquisition
- AED 2,155,000
- Latest resale
- Jun 2026
- Latest value
- AED 17,500,000
- Holding
- ~17 yrs
- Annualised
- ~13.2% / yr
Clean long-term highest case.
Esmeralda standalone villa
- Bedrooms
- 5
- Plot
- 7,106 sq ft
- First developer sale
- Nov 2010
- Acquisition
- AED 3,193,271
- Latest resale
- Feb 2026
- Latest value
- AED 11,850,000
- Holding
- ~15.3 yrs
- Annualised
- ~9.0% / yr
One of two equally distant median candidates.
Cohort statistic
- Valid properties
- 4
- Screened average
- +419.8%
- Screened median
- +432.5%
A more modest clean case in the cohort recorded ~+102.1%.
Carmen standalone villa
- Bedrooms
- 5
- Acquisition
- AED 6,400,000
- Annual rent
- AED 740,000
Historical gross yield on recorded cost.
Estella standalone villa
- Bedrooms
- 5
- Acquisition
- AED 2,200,000
- Annual rent
- AED 215,000
Near the screened median.
Cohort statistic
- Valid villas
- 13
- Screened average
- ~11%
- Screened median
- ~9.8%
Two implausibly high villa-rent rows excluded. Estella townhouses remain separate context.
Evidence, source and disclosures
Source. DXBinteract — Dubai Property Transaction Analytics Based on DLD Data
Data review date. 5 August 2026 · Published
Capital evidence
Same-property capital timeline retained from first recorded developer sale to latest valid resale.
Rental evidence
Historical gross yield from named per-unit rental-view records, using the recorded acquisition price.
Exclusions
Two implausibly high villa-rent rows excluded. A more modest clean capital case recorded approximately +102.1%. Estella townhouses kept separate.
Disclosures
Capital appreciation is measured from the first recorded developer sale to the latest valid resale of the same property; later buyers achieved different returns. Historical gross yield uses the investor’s recorded acquisition price and is not net ROI or a current-market yield. The screened average is a cohort statistic, not a separate property or a community-wide expected return. Property identifiers remain redacted.
Victory Heights shows that a community can contain an exceptional long-term result, a strong screened average and more modest individual outcomes at the same time.
Newer Integrated Community • Emaar
Dubai Hills Estate: Stronger Growth Over a Shorter Community History
Dubai Hills Estate is newer than several legacy communities but recorded substantial appreciation across selected early villa acquisitions.

Dubai Hills Estate
The Fairway standalone villa
- Bedrooms
- 5
- Plot
- 15,381 sq ft
- First developer sale
- Jul 2015
- Acquisition
- AED 6,532,888
- Latest resale
- Apr 2026
- Latest value
- AED 38,000,000
- Holding
- ~10.75 yrs
- Annualised
- ~17.8% / yr
Strong appreciation over a shorter community history.
Parkway Vistas standalone villa
- Bedrooms
- 6
- Plot
- 12,957 sq ft
- First developer sale
- Apr 2017
- Acquisition
- AED 16,229,888
- Latest resale
- Apr 2025
- Latest value
- AED 50,000,000
- Holding
- ~8 yrs
- Annualised
- ~15.1% / yr
Near the screened median.
Cohort statistic
- Valid properties
- 4
- Screened average
- +240.0%
- Screened median
- +192.5%
- Representative
- +208.1%
Results came from a different entry period, community stage and holding profile than legacy communities.
Golf Place 2 standalone villa
- Bedrooms
- 4
- Acquisition
- AED 8,700,000
- Annual rent
- AED 1,150,000
Historical gross yield on recorded cost.
Sidra 2 standalone villa
- Bedrooms
- 3
- Acquisition
- AED 3,400,000
- Annual rent
- AED 325,000
Near the screened median.
Cohort statistic
- Valid standalone villas
- 4
- Screened average
- 10.24%
- Screened median
- 11.17%
Maple compact-villa and townhouse-style properties shown separately rather than merged into the standalone-villa cohort.
Evidence, source and disclosures
Source. DXBinteract — Dubai Property Transaction Analytics Based on DLD Data
Data review date. 5 August 2026 · Published
Capital evidence
Same-property capital timeline retained from first recorded developer sale to latest valid resale.
Rental evidence
Historical gross yield from named per-unit rental-view records, using the recorded acquisition price.
Subtype separation
Maple compact-villa and townhouse-style properties shown separately from the standalone-villa cohort. Shorter history vs legacy communities is preserved as entry-period context.
Disclosures
Capital appreciation is measured from the first recorded developer sale to the latest valid resale of the same property; later buyers achieved different returns. Historical gross yield uses the investor’s recorded acquisition price and is not net ROI or a current-market yield. The screened average is a cohort statistic, not a separate property or a community-wide expected return. Property identifiers remain redacted.
Dubai Hills Estate shows that strong appreciation was not limited to the oldest communities, although its results came from a different entry period, community stage and holding profile.
The Strategy Behind the Results
Exceptional Performance Was Possible—But It Was Not Automatic
Earlier Entry
The highest percentage cases commonly began with lower 2008–2010 acquisition values.
Long Holding Periods
Many of the highest capital cases were measured over approximately 10–18 years.
Different Outcomes, Same Community
Highest, representative, average and lower-performing properties existed within the same community.
Later Buyers Earned Different Returns
A buyer entering at a later market value did not receive the property’s full developer-to-latest appreciation.
Property Type
Mansions, standalone villas, compact villas, townhouses and cluster homes should not be compared as identical assets.
Plot and Position
Waterfront, golf, park, internal-road, corner, privacy and plot-size differences affect market position.
Community Vintage
Older communities provide longer transaction histories; newer communities may still record strong performance with a different holding profile.
Rental Yield Depends on Entry Price
An earlier owner may show a high yield on cost because the property was purchased at a much lower historical value.
Strong performance came from the combination of entry price, property, community, time and execution — not from the word “villa” alone.
Related Villa Guide
Why Villas?
Understand the lifestyle, ownership, control and long-term asset considerations behind choosing a villa in Dubai.
The Strongest Number Is Not Always the Strongest Evidence
Records Were Excluded or Treated Conservatively
Published
A clean same-property chain or plausible same-property rental record.
Published Conservatively
A case where a more cautious acquisition basis provides a more defensible public result.
Excluded
A record containing an unresolved property, subtype, price or rental anomaly.
Worked examples
- Palm changed-plot capital case excluded from the public average.
- Palm 89.46% rental row excluded as implausible.
- Emirates Living +2,442% capital calculation replaced publicly with the conservative +518% basis.
- Jumeirah Park higher calculated cases excluded because the early registrations appeared implausibly low.
- Victory Heights implausibly high rental rows excluded.
- Arabian Ranches 1 implausible rental rows excluded.
- Townhouses and compact clusters separated from standalone-villa comparisons.
Evidence quality is more important than publishing the largest possible percentage.
Use the Data—Do Not Copy the Result
Historical Success Does Not Identify the Next Villa Automatically

- Define What the Capital Should Achieve
- Select the Community Stage
- Understand the Developer and Masterplan
- Compare Current Entry Price
- Assess the Property and Plot
- Calculate the Current-Buyer Case
- Maintain Holding Capacity
- Review the Strategy Over Time
Define What the Capital Should Achieve
- family ownership
- rental income
- long-term appreciation
- future relocation
- upgrading
- resale
- legacy ownership
Select the Community Stage
Compare established, growing and upcoming environments.
Understand the Developer and Masterplan
Review delivery, infrastructure, management, future phases and competing supply.
Compare Current Entry Price
Historical developer prices cannot be used as today’s acquisition basis.
Assess the Property and Plot
Review position, privacy, format, condition, rental audience and upgrade potential.
Calculate the Current-Buyer Case
- purchase price
- achievable rent
- ownership costs
- finance
- vacancy
- maintenance
- time horizon
- alternative exits
Maintain Holding Capacity
Avoid a strategy that depends on a forced short-term resale.
Review the Strategy Over Time
Track the property, community, rent, supply and future exit audience.
Use historical evidence to improve the next decision — not to assume the next result.
Villa Performance Advisory
Build the Strategy Before Buying the Asset
Clarify the Objective
Define how lifestyle, income, holding and future resale should work together.
Compare Communities
Assess maturity, developer, property formats, demand, supply and historical evidence.
Review the Current Entry
Compare the property or developer price with relevant current alternatives.
Assess the Villa
Review the plot, position, condition, rental audience and improvement potential.
Model the Ownership Route
Consider current price, historical evidence, achievable rent, maintenance, finance, vacancy, holding period and alternative exits.
Coordinate the Next Step
Support may include focused sourcing, developer or seller engagement, viewings, inspection, acquisition comparison, professional-team coordination, rental preparation, upgrade strategy and resale positioning.
We do not recommend a villa because it has the highest historical return. We use historical evidence to improve the quality of the next decision.
Common Questions
Villa Performance Case Study FAQs
Are the screened averages the average return for every villa in the community?
What is the difference between the representative property and the average?
Does the highest case show what a new investor can expect?
Why show the highest case at all?
Why is the Palm average lower than the original research table?
Why is the Emirates Living public result 518% rather than 2,442%?
Are rental percentages current-market yields?
Is gross rental yield the same as net ROI?
Why are townhouses separated?
Did every villa appreciate?
Does a recognised developer guarantee performance?
How should a current buyer use these case studies?

Invest With Evidence
Build the Strategy Before You Buy the Villa
The highest cases show what was historically possible. The representative properties and screened averages show that the wider reviewed evidence also recorded meaningful outcomes — without suggesting every villa performed equally. We will help compare the current community, property, entry price and ownership strategy before commitment.
Real evidence. Current analysis. A more intelligent villa decision.